Optimizing Quality Control with Feature Engineering (GLCM) & Random Forest
Automated Steel Defect Classification using Texture Analysis
Role: Computer Vision Engineer
Tools: Python, OpenCV, Scikit-learn, Pandas
Project Summary
Developed an end-to-end computer vision pipeline for automated industrial quality control, designed to classify surface defects on steel sheets (NEU-DET dataset).
Unlike standard "black box" Deep Learning approaches, this project utilizes classical machine learning (GLCM Feature Extraction + Random Forest) to prioritize model interpretability and low-latency inference. The final solution demonstrates how targeted feature engineering can resolve complex class overlaps (e.g., Crazing vs. Patches) to create a robust, edge-ready deployment model.
The Challenge
In high-speed steel manufacturing, manual visual inspection is prone to fatigue and error. While Deep Learning (CNNs) is a standard solution, it often requires massive computational power and lacks interpretability.
Objective
Build a lightweight, interpretable machine learning pipeline to classify 6 types of steel surface defects (NEU-DET dataset) suitable for edge deployment.
Technical Approach
1. Data Pipeline (Preprocessing and Augmentation)
To ensure model robustness and simulate real-world conveyor belt variances, I built a preprocessing pipeline:
Grayscale Conversion & Smoothing: Converted RGB images to 1-channel and applied Gaussian Blur to suppress high-frequency noise.
Synthetic Augmentation: Expanded the training set by applying random rotations (0-360°) and horizontal/vertical flips. This forced the model to learn rotation-invariant texture features rather than memorizing specific defect orientations.
2. Feature Engineering (v1 Baseline)
I developed a function to extract 6 Global Statistical Features to capture the general distribution of pixel intensities:
First Order Statistics: Mean Intensity, Standard Deviation (Contrast).
Distribution Shape: Skewness (Asymmetry), Kurtosis (Tail heaviness).
Texture/Complexity: Entropy (Randomness) and Edge Density (via Canny Edge Detection).
3. Model Selection
I benchmarked three classifiers—SVC, Random Forest, and KNN on this V1 feature set.
Normalization: Studied the distribution of each feature and tried Standard Scaler, Min Max Scaler and Robust Scaler with all models.
Benchmarking Metrics: Considered mean accuracy across number of folds and repeats along with ROC-AUC to compare models.
Classification Report and Confusion Matrix: Benchmarked best models for finer details after fine tuning hyper-parameters.
The Engineering Iterations
Phase 1: Baseline Evaluation & Failure Analysis
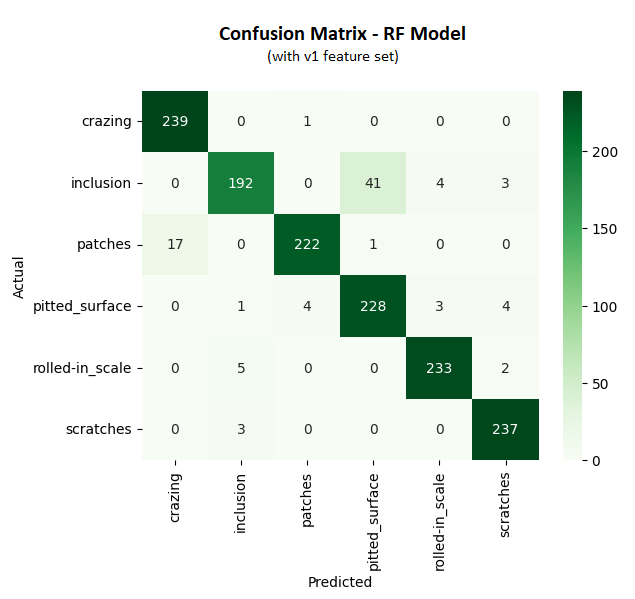
After hyperparameter tuning, I selected Random Forest and SVC as top candidates. While the initial accuracy was promising, the Confusion Matrix revealed two distinct failure patterns:
Critical Failure (Pitted Surface vs. Inclusion): This was the highest source of error (40 misclassified samples), dropping the precision for "Pitted Surface" to just 77%.
Secondary Failure (Patches vs. Crazing): This was the second highest confusion cluster (13 misclassified samples).
The Diagnosis: The global statistical features (Mean, Std Dev) were "blind" to the structural differences. To the model, a surface with many small pits looked mathematically identical to a surface with one large inclusion.
Phase 2: Targeted Feature Engineering (v2)
I returned to the feature extraction pipeline to engineer specific solutions for these two failure modes:
Solution 1: Blob Analysis (for Pitted vs. Inclusion)
Observation: "Pitted Surface" defects are characterized by a high frequency of scattered dark spots, whereas "Inclusions" typically manifest as one or two isolated larger anomalies.
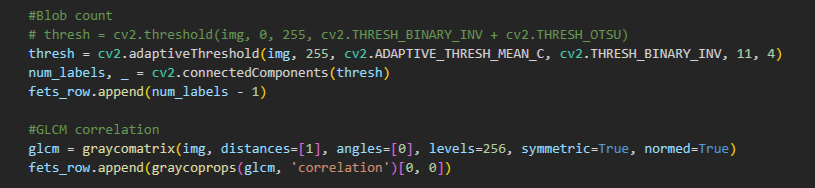
Implementation: I added a Blob Count feature using a blob detection logic.
Hypothesis: High blob count > Pitted Surface; Low blob count > Inclusion.
Solution 2: GLCM Correlation (for Patches vs. Crazing)
Observation: "Patches" are large, uniform defects where a pixel is highly likely to be similar to its neighbor. "Crazing" consists of web-like jagged interruptions, introducing frequent high-frequency changes.
Implementation: I integrated GLCM (Gray-Level Co-occurrence Matrix) Correlation, which measures the linear dependency of gray levels at neighboring pixels.
Hypothesis: Patches will yield a High Correlation score (smooth local texture), while Crazing will yield a Low Correlation score (frequent texture interruption).
Phase 3: Final Model Selection
I tested this V2 feature set on both candidates:
SVC: Failed to improve significantly. It struggled to separate the classes even with new features, suggesting a complex non-linear boundary it couldn't map efficiently.
Random Forest: Successfully leveraged the new split points. The tree structure effectively used "Blob Count" as a primary node to split Pitted Surface from Inclusion, and "GLCM Correlation" to separate Patches from Crazing.
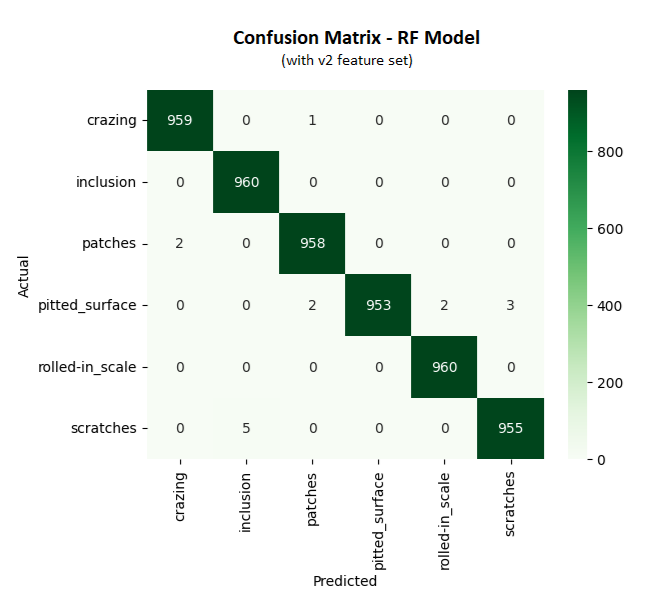
Result
The Random Forest model with the V2 feature set delivered overall accuracy of 99.7% on the validation set and was selected for production, significantly raising the precision for the "Pitted Surface" class.
Final Result
Validation Accuracy: 99.7%
Outcome: A highly interpretable model that allows operators to understand why a defect was flagged (based on texture limits) rather than relying on a black-box probability.